
get in touch

In a typical debugging scenario, breakpoints are used to signal the debugger to pause the program. These breakpoints usually represent the initial points for deeper investigation.
Choosing the right place for a breakpoint can be difficult. Sometimes the exact line isn’t obvious, or you might want to pause the program based on timing rather than specific code.
This article explores IntelliJ IDEA’s Pause Program feature, a lesser-known but highly effective debugging technique for such situations. We will cover its use cases, and limitations, and reveal a secret stepping trick.
What is Pause Program?
Pause Program is a feature in IntelliJ IDEA’s debugger that allows you to suspend your application at any moment. The best part is, you don’t need to be familiar with the application code or even look at it!
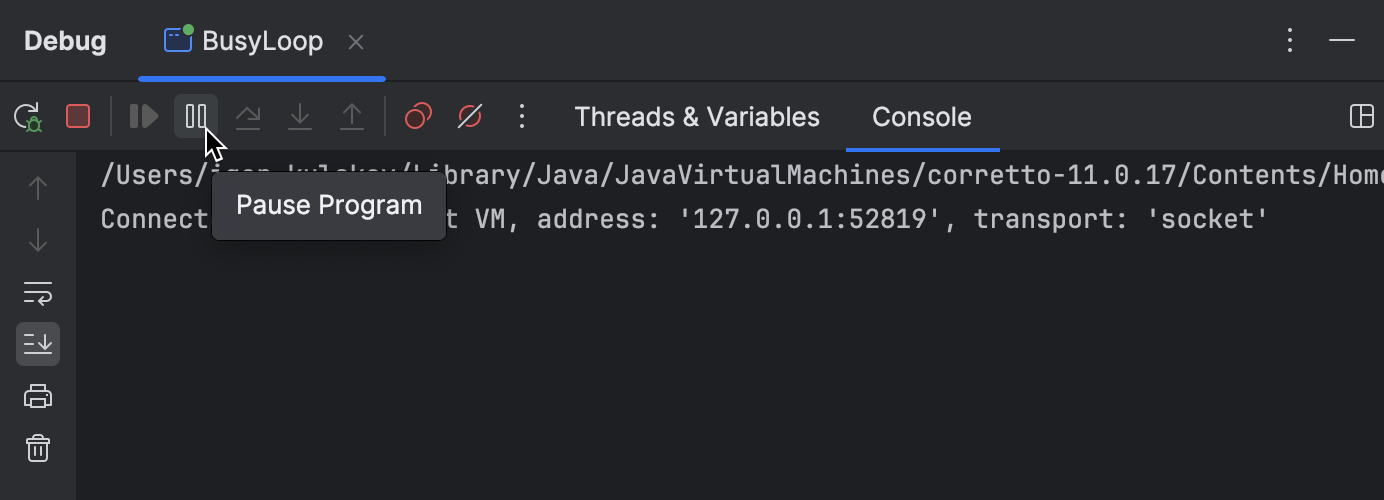
To pause a program, simply click “Pause Program” on the debugger’s toolbar. The program will then suspend immediately, no matter what it is currently doing.
Limitations
At first glance, a paused program may appear identical to one that has been suspended at a breakpoint. However, this similarity is only superficial.
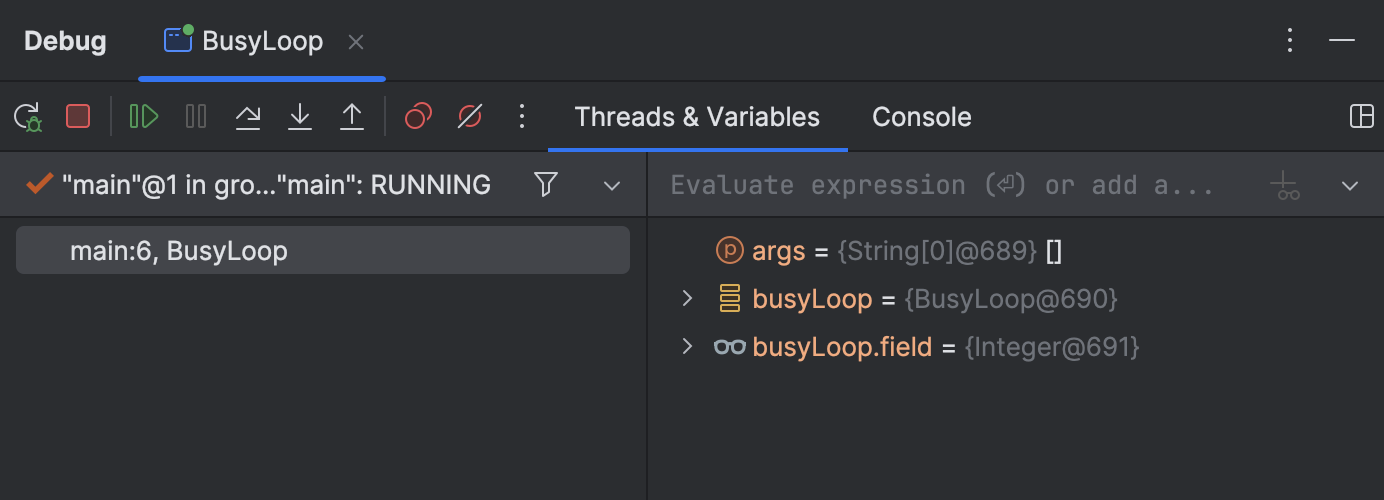
Pause Program can be considered a type of enhanced thread dump. You can still inspect variables and threads as usual, but some advanced debugging features, like Evaluate Expression, won’t be available.
Use cases
There are numerous ways to use Pause Program, and it can often be used interchangeably with traditional breakpoints. However, there are situations where Pause Program is the more appropriate choice. Let’s explore a couple of these scenarios.
Unresponsive apps
If the UI freezes or becomes unresponsive, it’s often because the UI thread is blocked or occupied with a time-consuming task.
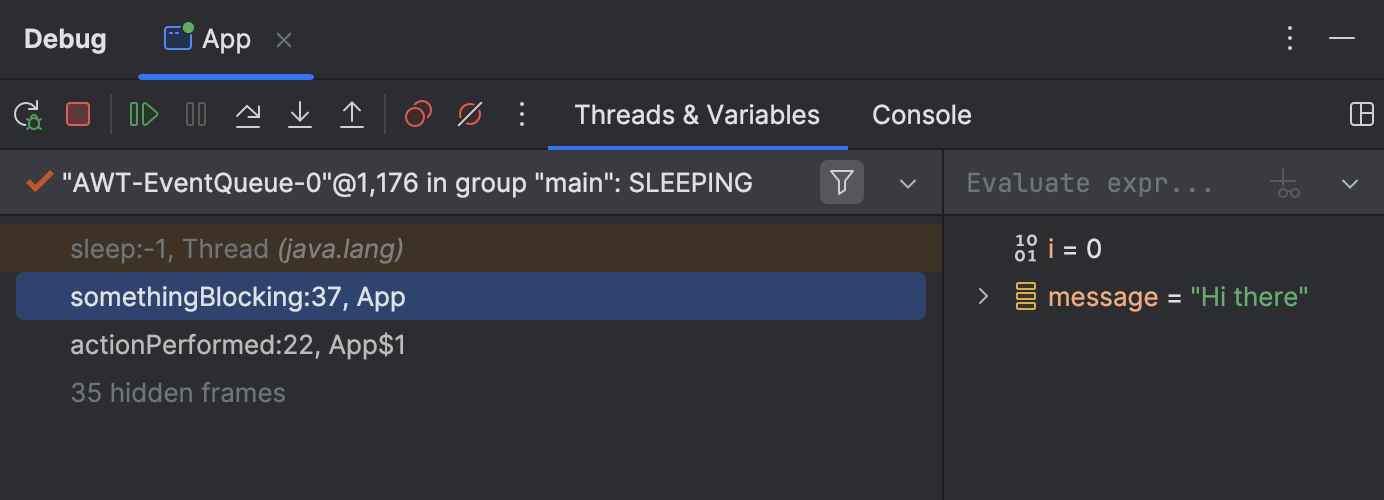
Pause Program could be valuable in both of those scenarios. It enables you to halt the application when it becomes unresponsive, allowing you to inspect the call stack of the UI thread. This can often provide enough information to diagnose the issue.
Mission sources
As mentioned earlier, Pause Program lets you bypass the need to engage with the source code, which you might not have or need to understand. While this situation isn’t common, when it does occur, breakpoints are not useful. This is where Pause Program proves invaluable!
Locks
If you suspect a synchronization issue like a deadlock or livelock, Pause Program can assist in identifying the specific threads and locks contributing to the problem.
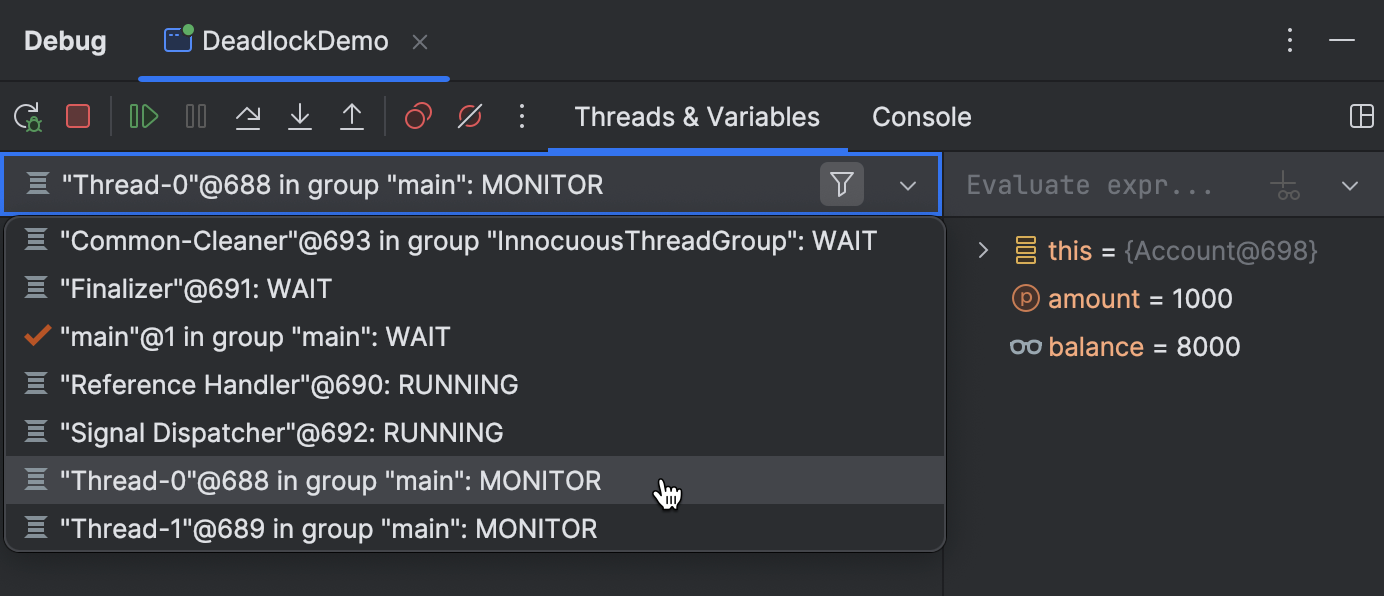
In this scenario, pause the program and examine the thread list. This will reveal which threads are currently blocked. Navigating to the execution point will show you the critical sections where these threads are locked. This insight can be crucial in guiding you toward a resolution.
Secret stepping trick
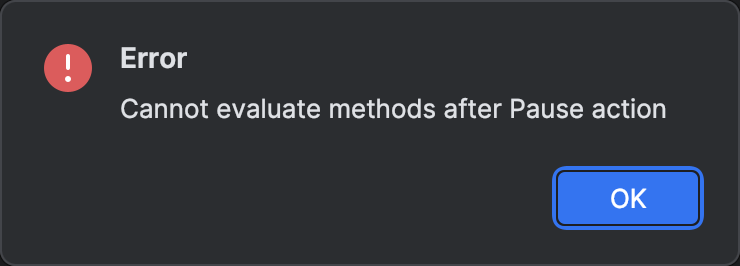
As mentioned earlier, Pause Program does restrict access to certain advanced debugger features. If you’ve attempted to use these features while the application is paused, you might have encountered an error message stating “Cannot evaluate methods after Pause action.”
However, there is a workaround for this limitation. After pausing the application, proceed with any stepping action, such as Step Into or Step Over. Once this is done, you will transition into a regular debugging session, similar to when you suspend an application using a breakpoint. At this point, all advanced features will be unlocked and accessible.
Conclusion
That wraps up today’s tips and tricks! We hope you found them useful.
If there’s a specific aspect of Java debugging you’d like us to explore further, please reach out! Your feedback helps us prioritize and publish content that is most valuable and interesting to you.
Blog resource: https://blog.jetbrains.com/idea/2024/06/debugger-upskill-debug-without-breakpoints/
otherTech Blog
01
 02
02
 03
03
 04
04
 05
05

In the news
CLion 2026.2 is focused on the work around the code
29.04.2026
In the news
March updates – proactive AI experiments in JetBrains IDEs, plus Junie CLI in Beta
26.03.2026
In the news
February updates – Java-to-Kotlin conversion in VS Code, plus modern Go output from AI agents
27.02.2026
In the news
January updates – Codex arrives in JetBrains IDEs, plus the CLion 2026.1 roadmap
29.01.2026
In the news
JetBrains December updates – Unified IntelliJ IDEA, CLion 2025.3, Scala Plugin 2025.3, and Junie in AI Chat