
get in touch

Every day, news and media inform us that by staying at home we can protect ourselves from COVID-19. Here’s the question – is there a way we can mathematically prove or disprove this claim?
There actually is, and we’ll show you the math in this blog.
The whole idea behind staying outside is avoiding unnecessary social contact and maintaining distance from the rest of the world. Doing so should reduce the growth rate by which COVID-19 spreads among the population by an amount. But how significant is that amount?
As it turns out, very significant.
At the moment of writing this article we had at our disposal cumulative data up to April 19. Up to this date we had 2.401.378 confirmed cases worldwide. But we need additional information before jumping to conclusions – we’re also interested in the average growth rate from a time period – let’s say the last 7 days. This can be obtained by simply dividing today’s number of confirmed cases by the number from the day before. The result is a number that should be close to one.
In a phase of Exponential growth this number would be constantly greater than one and is roughly 1.03 if we’re comparing April 18 and April 19. Once the world approaches the inflection point, we can expect the growth rate to be constantly around 1 and to go downhill from there.
Before jumping to conclusions about the #StayAtHome claim, let’s further explore what’s really behind the hottest „scientific“ term these days – Exponential growth.
Exponential and Logistic Curves Primer
Note from the authors: This part is completely optional to read as it contains a deeper dive into the mathematics and reasoning behind mentioned curves. You are free to entirely skip this part, or at least to read the last paragraph, as it makes a short summary from the whole section.
At the beginning of COVID-19 pandemic, observed confirmed cases globally were growing fast, which can be interpreted as Exponential growth. Each day we got more and more cases without seeing the attention of pandemic slowing down.
But is this the case of Exponential growth? Let’s explore further.
Let’s say you have money invested at a fixed rate of interest. The amount of interest you earn is proportional to how much money you invested. If we try to visualize that data, it will show Exponential growth.
In an epidemic case, we can conclude that there must be a maximum number of cases, it cannot grow forever. Since we are observing the global situation, our maximum number would be the global population.
If this pandemic can be described exponentially, then what happens when the number of infected reaches the global population number? We know there cannot be another infected case the next day, because the entire population is sick, and the growth rate doesn’t exist anymore.
It is not possible for exponential function to just stop at some point, which leads us to new function, Logistic function. This function is also called population growth function, and it is used to model real-life cases in which growth changes—from an increasing growth rate to a decreasing growth rate. According to this, the first period of a pandemic can be explained as Exponential growth, but it will eventually slow down.
In conclusion, the total period of a pandemic can be modelled with Logistic growth. Due to many studies, it is shown that every new virus outbreak would approximately follow the Logistic curve. We will not go into deep mathematics, simply by comparing exponential and logistic growth we can observe the following.
Exponential curve formula:
yt=k × yt-1
Where:
t: time period for which we observe values
k: slope of the function
Observing this function, at the beginning of the period we had 100 cases and growth rate is 0.17. That means that after 1 day we would have 100 × (1 + 0.17) = 117 cases.
Logistic curve formula:
yt=k × yt-1(N – yt-1)
Where:
N: maximum possible number of infected people – usually calculated as a percentage of target population, in our case it would be the global population number
t: time period for which we observe values
k: slope of the function
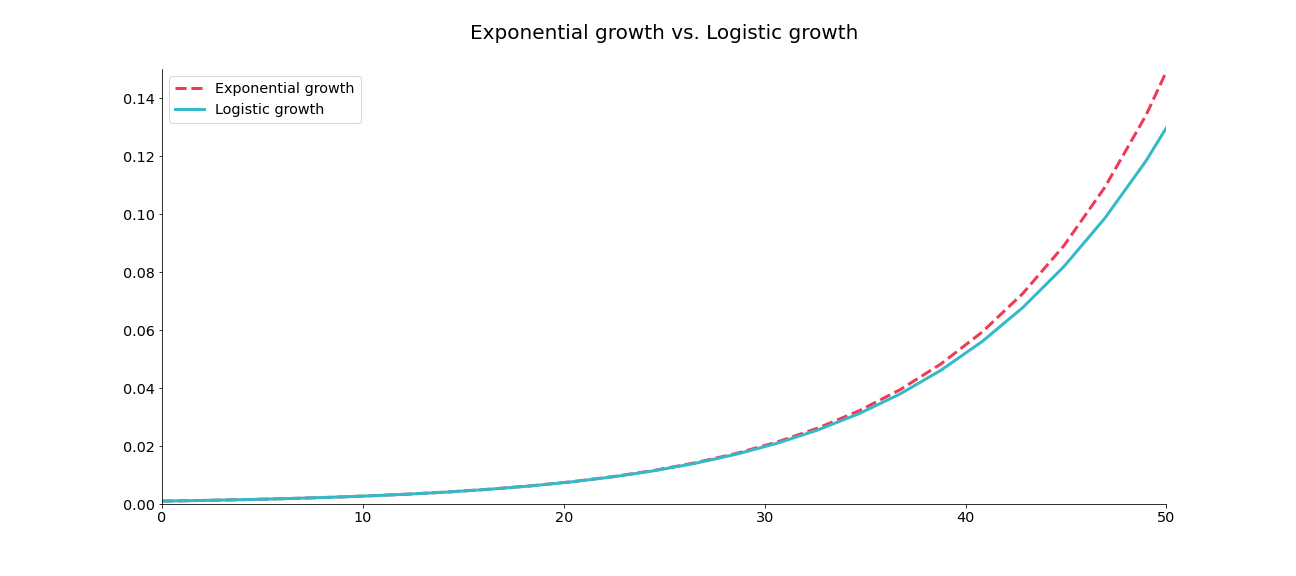
At the beginning of the period, both exponential and logistic curves are very similar. In other words, growth of confirmed cases can be interpreted as Exponential growth at the beginning of the pandemic:
If we observe the entire time period, we can see differences in the growth factor and just how big of a mistake we would be making if we modelled pandemic cases as exponential:
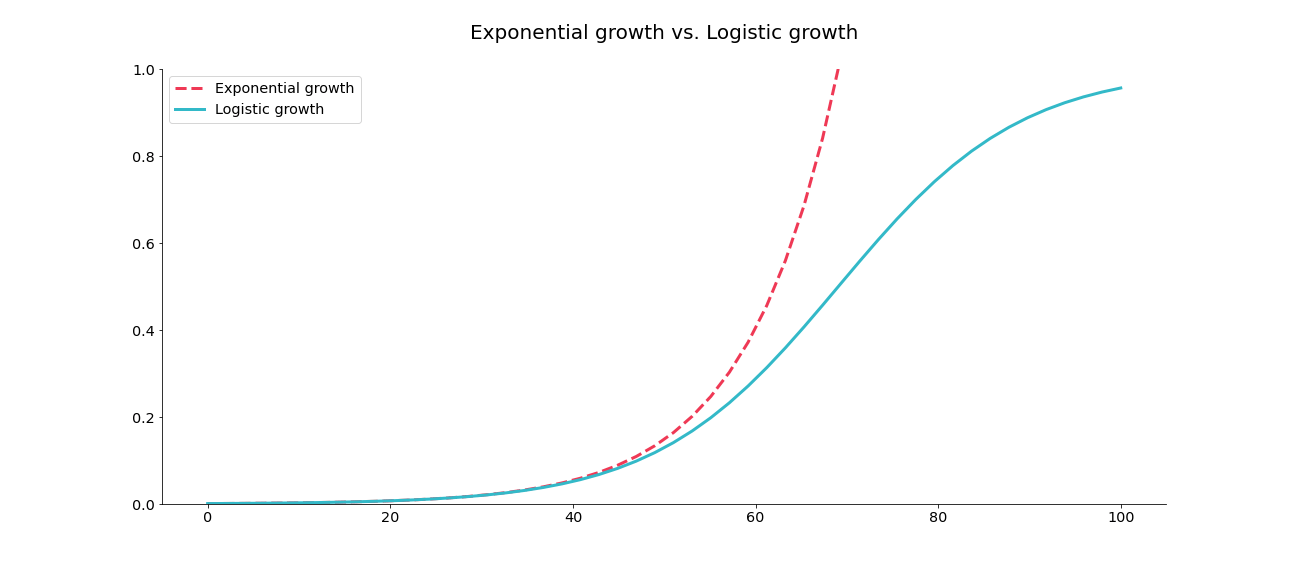
The main difference is that Exponential growth has no limit, while Logistic growth has a limit of maximum possible cases that can be observed. If you look closely, you can see that Logistic growth is changing from rapidly growing to more slowly growing stage, meaning that in the growing stage, the slope k>1, in the slowing down stage it’s k<1, but when k=1, we hit the point where the stage of rapid growth is over.
The “take home” point: epidemics will generally follow the logistic curve – not the exponential one – but at the beginning they look roughly the same. Since the term „exponential“ is more familiar to broader audience than the term „logistic“, that’s the one more often used in media. True Exponential growth doesn’t exist in the real world. That’s what you should remember.
Back to COVID-19 Case
Disclaimer: Growth rate depends on many factors that can influence COVID-19 spread, such as population density, location etc. Primary thought of the following analysis is to show to what extent prevention affects the spread of pandemic. All results are just approximations that were obtained for the selected coefficient and do not represent predictive values.
We now have some basic intuition and understanding on how the epidemic spreads and why it isn’t a good idea to model it with the exponential function. To prove/disprove the #StayAtHome claim, we will use something known as calculated growth factor – an average of last 7 days growth rate.
At the time of writing this article (April 19), it was roughly 1.039.
It might not sound like a lot to you – but here’s why you’re wrong. If we are to expect the same growth in the following 30 days, the expected number of confirmed cases can be calculated as follows:
Xt+n=Xt × αn
Where:
xt: number of confirmed cases today
n: number of days into the future
α: average growth rate
Once we put in the numbers, we get an alarming result:
Xt+n = Xt × αnXt+n = 2401378 × 1.03930Xt+n = 7612085
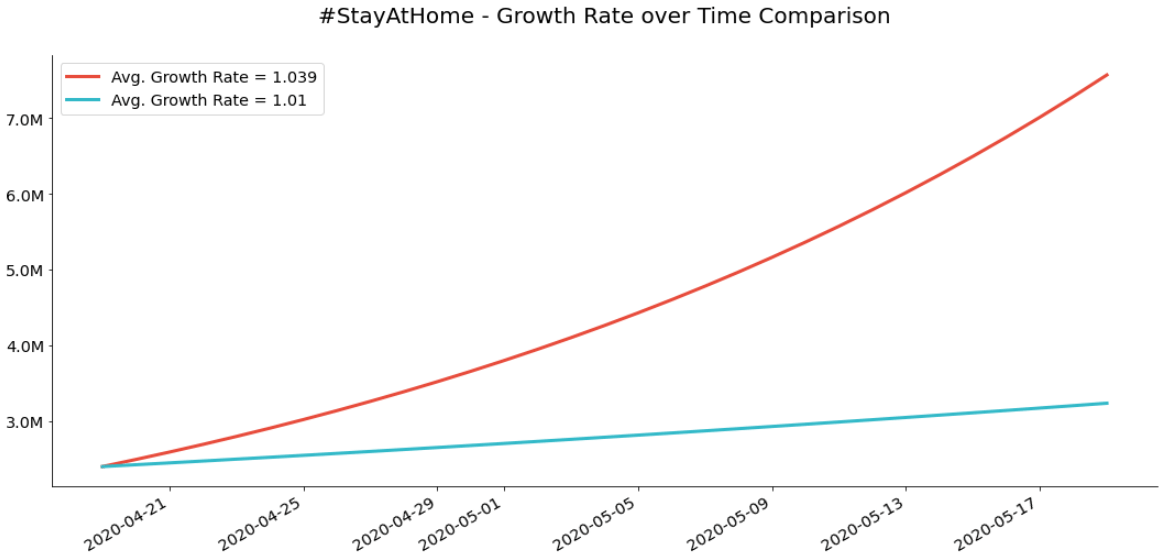
This means that if no additional measures are taken to make people stay inside and the growth rate remains roughly the same, in 30 days we can expect 7.612M people to be infected worldwide!
If, however, by following rules made by government and institutions, we manage to reduce the average growth rate to, let’s say, 1.01, the situation will drastically improve:
Xt+n = Xt × αn Xt+n = 2401378 × 1.0130Xt+n = 3236694
Well, the number isn’t small by any means, but 3.2M sounds a lot better than 7.6M.
In case you’re just not a numbers person, here’s a visualization that sums up everything said previously:
Conclusion
As seen, #StayAtHome prevention, combined with other measures, has a big influence on COVID-19 growth rate. There are many things we can’t control, but we can be patient and hope that pandemic will end soon, or at least go on standby.
Even though many developed pandemic models can help us get a better understanding of COVID-19 “behaviour “, with each new virus outbreak we are learning more and trying to model predictive case scenarios. Since there is still no cure, we need to stay at home and take care of our loved ones and hope for the best.
Data Sources
Just in case you decide to reproduce our results, or take the whole thing a step further, here’s where you can obtain the dataset we’ve used:
otherTech Blog
01
 02
02
 03
03
 04
04
 05
05

In the news
The next stage of AI development isn’t smarter models – it’s better coordination
23.07.2026
In the news
The real shift in AI coding agents is workflow, not model choice
30.06.2026
In the news
Small changes, less friction – recent JetBrains updates worth knowing about
26.05.2026
In the news
CLion 2026.2 is focused on the work around the code
29.04.2026
In the news
March updates – proactive AI experiments in JetBrains IDEs, plus Junie CLI in Beta