

get in touch


A red underline in the editor usually means something needs attention. But what if the code is correct and the IDE has simply misunderstood it? Or what if the code compiles perfectly, yet behaves differently once it runs on actual hardware?
Both situations expose a familiar problem in software development: having information is not the same as having the right information.
Developers depend on their tools to identify problems, explain what is happening and help them investigate. When those tools produce misleading diagnostics, repeat unnecessary checks or require constant switching between environments, the investigation becomes harder than it needs to be.
Two recent JetBrains developments approach this challenge from very different directions. IntelliJ Scala plugin 2026.3 improves the accuracy and efficiency of code analysis, while the integration between CLion and Lauterbach TRACE32 brings embedded hardware debugging into the IDE, including access for AI agents.
Together, they illustrate why better development tooling is not necessarily about adding more features. Sometimes, the most useful improvement is making existing information more accurate, accessible and actionable.
When the IDE reports a problem that isn’t there
Modern programming languages can make code analysis surprisingly difficult. Scala 3, for example, combines sophisticated type inference, contextual abstractions and extension methods. Understanding how these constructs interact requires more than recognising syntax.
When an IDE interprets them incorrectly, developers may see errors that the compiler would never report. The code is valid, but the editor suggests otherwise.
These false positives create friction. Developers spend time investigating problems that do not exist, checking whether the IDE or the compiler is correct and sometimes learning to ignore warnings that should normally deserve attention.
The latest IntelliJ Scala plugin addresses several sources of this problem. Version 2026.3 improves how extension methods are resolved, how contextual arguments are selected and how types are inferred in complex Scala 3 expressions. The release also adds support for Scala 3.10.
The significance is not simply better language support. It is that developers can place greater confidence in what the editor tells them.
The same principle applies beyond Scala. Static analysis is most useful when developers trust its findings. Reducing misleading diagnostics helps preserve that trust, allowing genuine problems to stand out rather than disappear into a collection of warnings.
Less background work, more useful feedback
Accuracy is only part of the equation. Feedback also needs to arrive at the right time without unnecessarily interrupting development.
Consider compiler-based highlighting. Using compiler diagnostics can provide valuable information about code correctness, but repeatedly compiling unchanged code consumes resources and can make the editor less responsive.
IntelliJ Scala plugin 2026.3 changes how this work is managed. It reuses valid diagnostics when developers switch between files, reduces unnecessary background checks while typing and combines pending checks across multiple files into fewer compilation runs.
It also improves what happens when errors in one module prevent analysis of another.
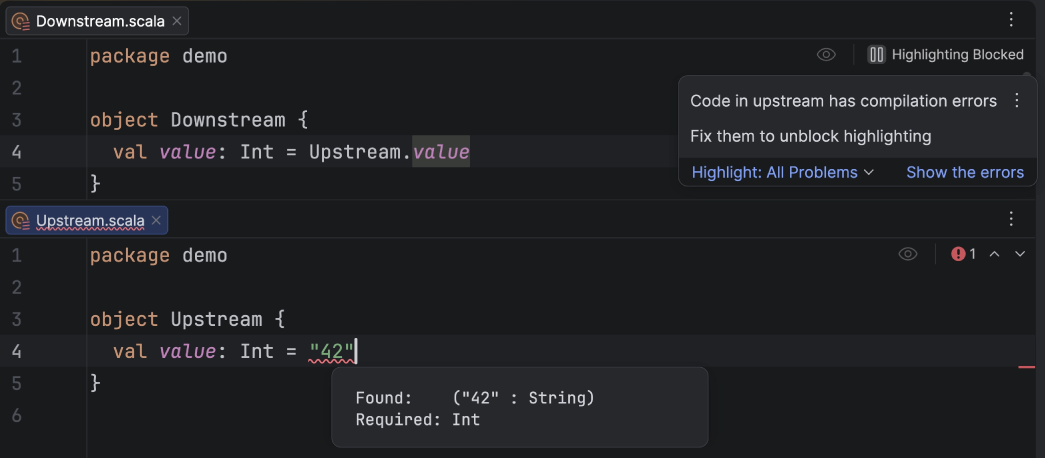
Instead of repeatedly attempting compilation or leaving developers wondering why highlighting is unavailable, the IDE can explain that an upstream module is blocking the process and direct them to the relevant errors.
The Scala plugin identifies an upstream compilation error that prevents highlighting in a dependent file and provides a link to the underlying problem. (Source – JetBrains Blog)
This is a small but important distinction. A tool that cannot complete an operation is more useful when it explains why than when it simply stops producing results.
The improvements also highlight a broader productivity issue: development tools perform a considerable amount of work that developers never explicitly request. How efficiently that work is managed can influence the everyday experience just as much as visible features.
When understanding the code isn’t enough
Not every software problem can be understood by analysing source code.
In embedded development, software interacts directly with processors, memory, peripherals and hardware-specific conditions. An application may compile successfully and still behave unexpectedly on its target device.
Investigating that behaviour often requires specialised debugging equipment and software. Developers may write code in one environment, move to another to control the hardware debugger and then return to their IDE to interpret what they have discovered.
That separation introduces its own friction. The information needed to understand a failure exists, but accessing it interrupts the development workflow.
The integration between JetBrains CLion and Lauterbach TRACE32 addresses this problem by connecting the IDE to TRACE32 through the Debug Adapter Protocol (DAP).
TRACE32 handles the connection to the target, while CLion provides the interface for controlling debugging sessions and inspecting program state. Developers can work with source code and investigate behaviour on real hardware without constantly moving between separate debugging interfaces.
This matters particularly when diagnosing problems involving multiple execution cores, memory or hardware-specific behaviour. The source code describes what the program should do, but the debugger reveals what it is actually doing.
Bringing those perspectives closer together can make it easier to connect an observed failure with the code responsible for it.
Giving AI agents access to what the debugger knows
The CLion integration introduces another possibility: allowing AI coding agents to participate in debugging sessions using information from the actual target.
Through CLion’s built-in Model Context Protocol (MCP) server, compatible agents can access debugger capabilities and inspect program state. Because CLion communicates with TRACE32, that information can come from an embedded target rather than only from source files or logs.
JetBrains demonstrated this workflow using a four-core Infineon AURIX board. In the demonstration, Claude Code starts a debugging session through TRACE32 and inspects registers and memory across the four cores.
The important detail is not simply that an AI agent can operate a debugger. It is that the agent can investigate using live information about the system rather than relying exclusively on a description of the problem.
For example, source code might suggest that a variable should contain a particular value. A paused debugging session can expose the value actually present in memory. That distinction gives an investigation something concrete to work with.
The developer remains part of the process. CLion uses its standard debugger interface, meaning the session is visible in the IDE and can be paused or taken over manually.
This is a useful model for AI-assisted debugging: the agent can help collect and examine evidence, while the developer retains visibility and control.
There are limits to the current integration. JetBrains describes it as being at an early stage, without instruction and data trace, a built-in trace viewer or general real-time variable updates. Direct execution of TRACE32 commands from CLion is also not yet supported, although PowerView can still be used alongside it.
These limitations matter because access to debugger state is not the same as complete support for every hardware debugging workflow. The integration expands what developers and agents can investigate within CLion, but it does not replace every capability of specialised debugging tools.
Better context leads to more useful tools
The Scala plugin improvements and the CLion integration solve different problems for different developers.
One reduces misleading information before code runs. The other makes runtime information from embedded targets more accessible during debugging. One focuses on interpreting complex language constructs correctly, while the other connects source code with the behaviour of a physical system.
Yet both address the same underlying challenge: developers need tools that help them understand problems without creating unnecessary obstacles along the way.
For engineering teams, this is worth considering when evaluating development environments. More features do not automatically mean a better workflow. The quality of diagnostics, the cost of background processing, the ability to investigate failures and the ease of moving between development and debugging all affect how effectively problems can be resolved.
AI adds another dimension, but it does not change the fundamentals. An agent working with incomplete or misleading information faces many of the same limitations as a developer. Giving it access to relevant code intelligence or actual debugger state may improve the investigation, but the quality of that information remains essential.
Ultimately, useful development tooling is not defined only by how much it can do. It is defined by how well it helps developers distinguish genuine problems from distractions, find the information they need and understand what their software is doing.
Whether that means fewer false errors in Scala or investigating a processor through CLion, the goal is the same: less time questioning the tools and more time solving the problem.
otherTech Blog
01
 02
 03
 04
 05

Tech Blog
When IDE intelligence is no longer tied to the IDE
27.10.2026
In the news
Java 27 is here – but staying current shouldn’t disrupt your development workflow
30.09.2026
Tech Blog
IntelliJ IDEA goes LSP – what happens when IDE intelligence stops being tied to the IDE?
31.08.2026
In the news
The next stage of AI development isn’t smarter models – it’s better coordination
23.07.2026
In the news
The real shift in AI coding agents is workflow, not model choice